


One view, zero noise
All your data in one place. See what matters and focus on growth.
Instantly.
Clarity at a glance
All your key metrics in one place.
See what's working and see what's not.
Never get caught off guard
Alerts show issues before they become problems.
See what happens,
as it happens
See every move in real time.
Decide with today's data, not yesterday's.
Turn clarity into action
Clarity removes hesitation.
Make decisions you trust.
One source of truth
Your whole team sees the same live data:
reliable, consistent and aligned.
At Illustrated, we believe data should bring serenity,
not confusion. We turn scattered information into one clear and reliable source of truth.
Dashboards are the outcome, not the beginning.
We bring structure to your data and connect what truly matters.
Today, 97% of major companies rely on data to drive their growth. We make the same power accessible to small and medium-sized businesses, but without the complexity or the cost.
Profit comes first
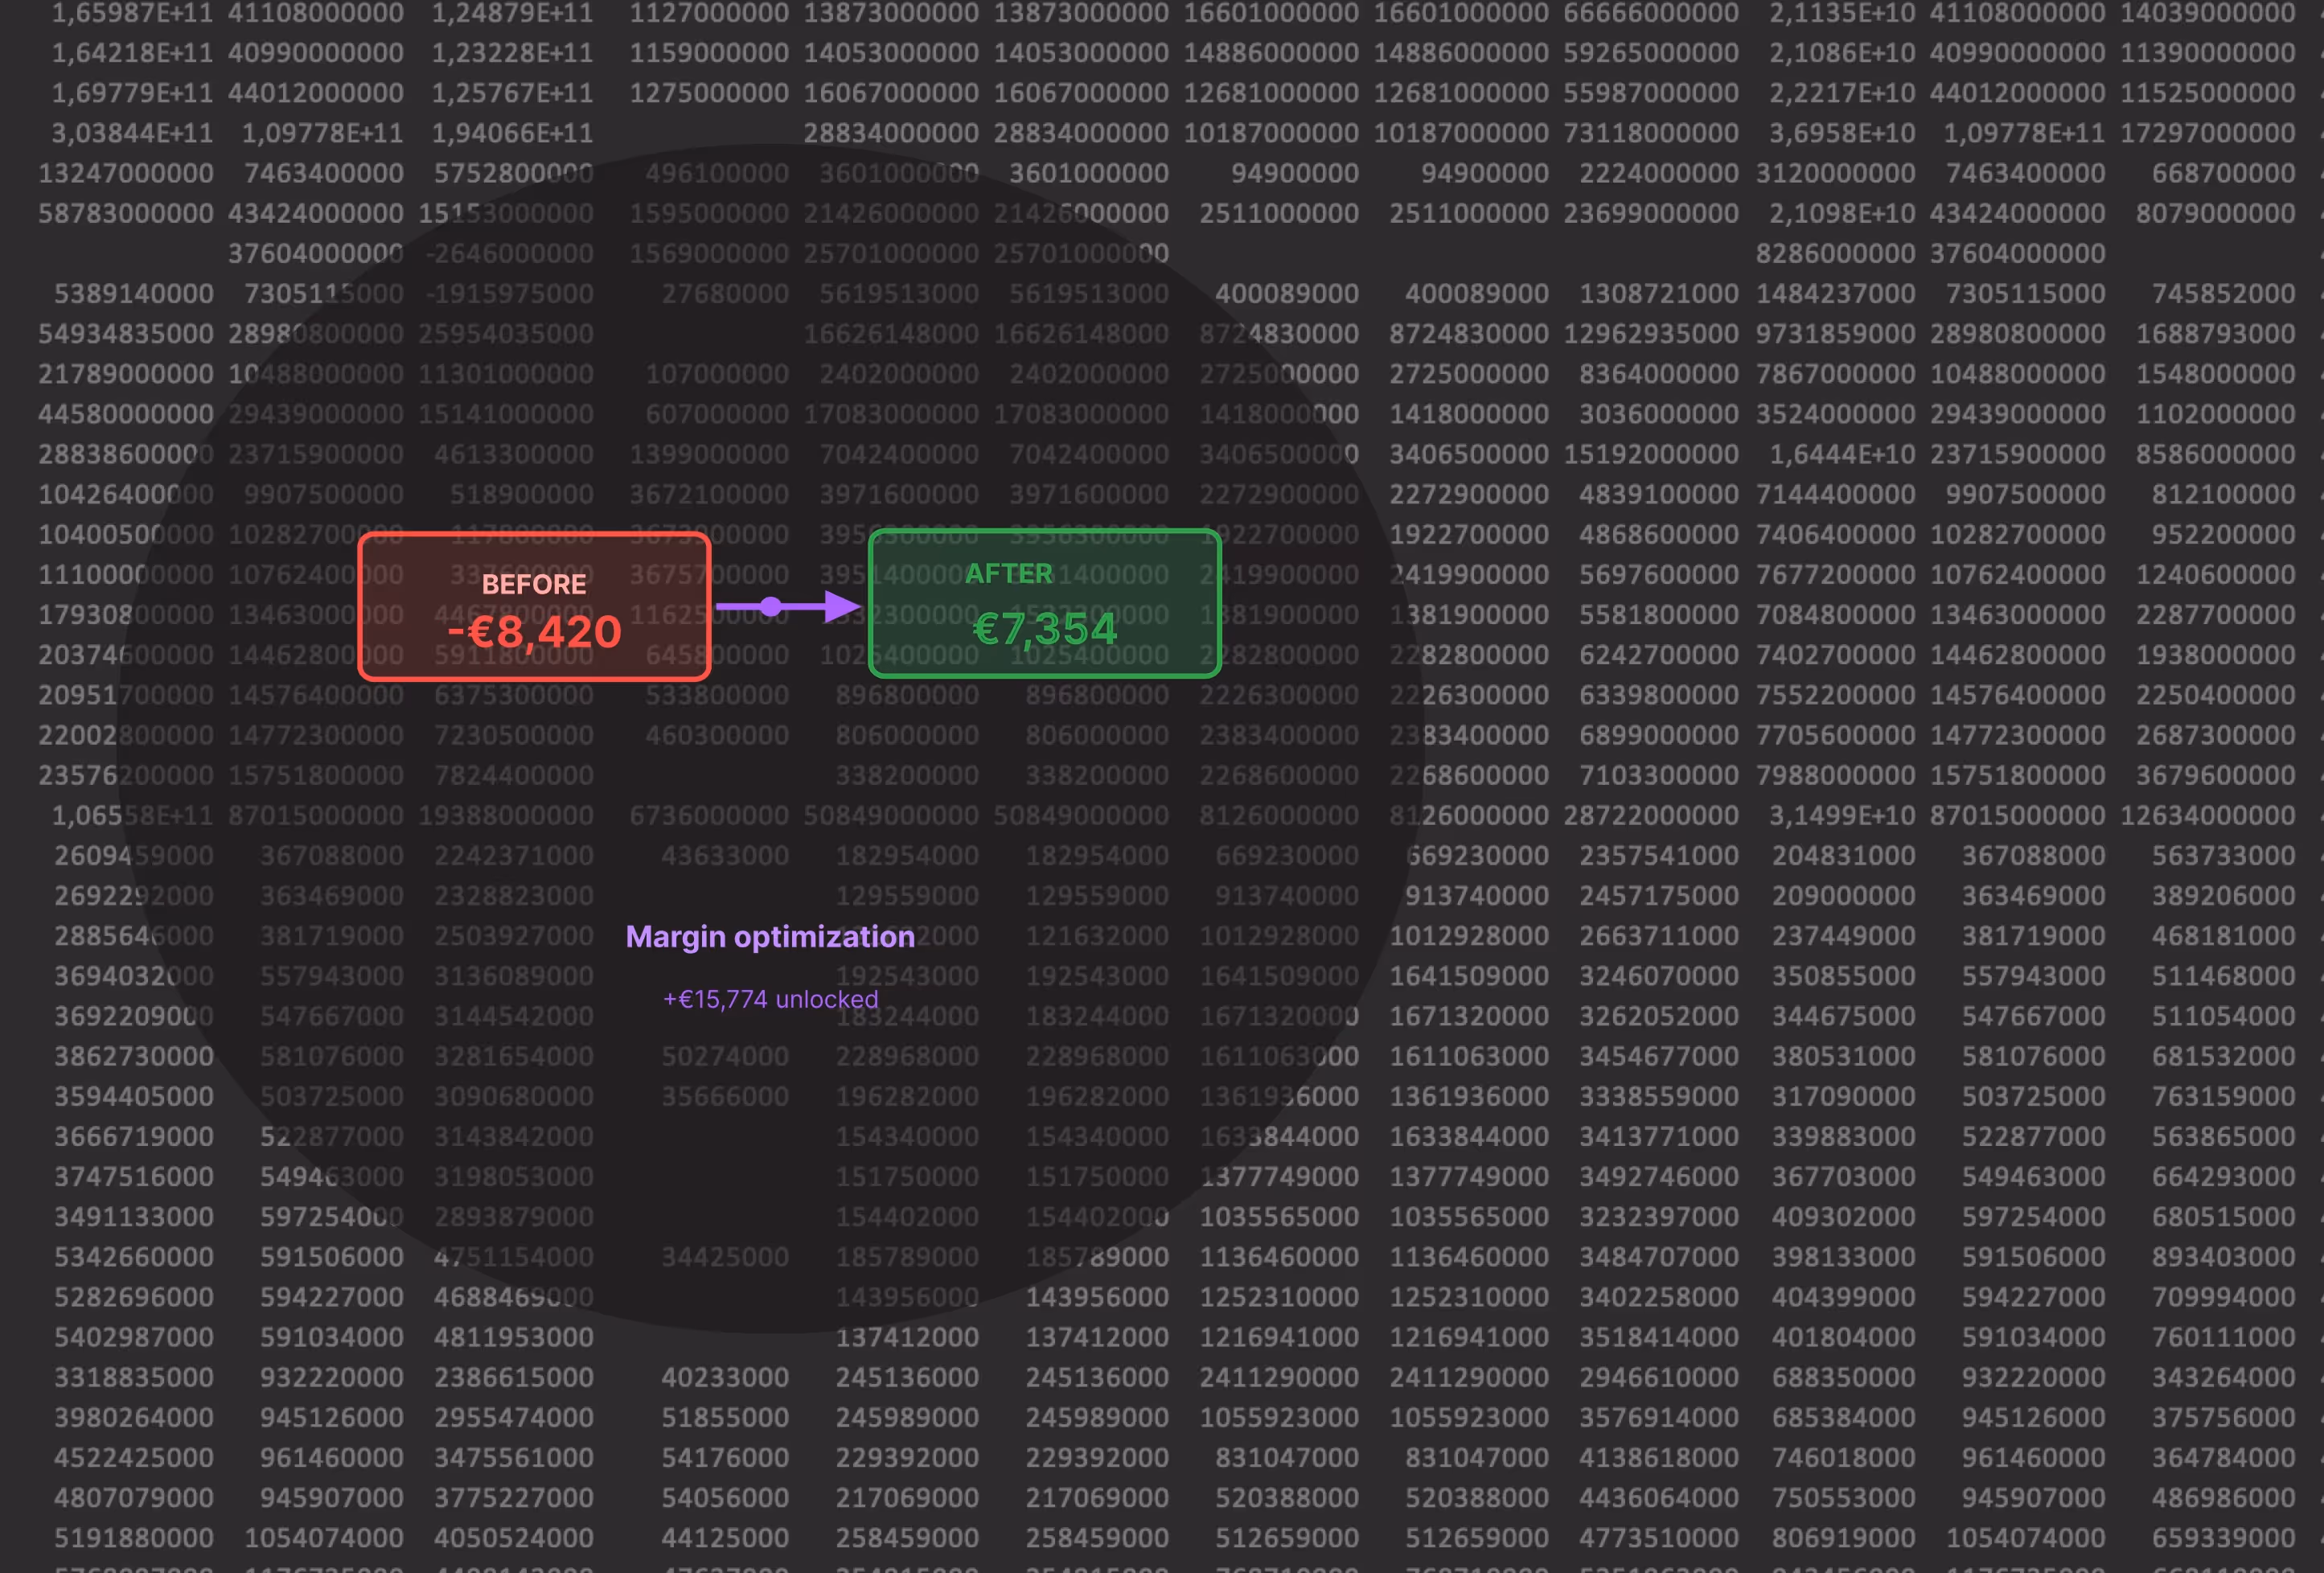
We don’t just show your numbers: we hunt for profit.
Profit hides in the details. We find it, sharpen it, and turn it into clear decisions.
Custom from day one
No templates. No prebuilt solutions.
We start from a blank canvas and design everything around your business, not the other way around.
Built with empathy
We treat your business like our own.
We listen to your worries, analyse what hurts, and turn data into clarity, confidence and calm.
If something feels off, we dig until we know why.
Always improving
We don’t just show what’s wrong: we show how to fix it.
We benchmark, analyse and refine continuously, so your clarity grows and your results improve over time.
One source of truth
Everything connected. Everything live.
One version everyone can trust. No duplicates, no doubts, no outdated files.
.avif)
Tools that work the way your business works.
Finance, sales, HR, marketing and alerts: the essentials every business needs.
We build each of them from the ground up, fully tailored to the way you work.
And beyond these essentials, we create à la carte tools whenever your business needs something unique.
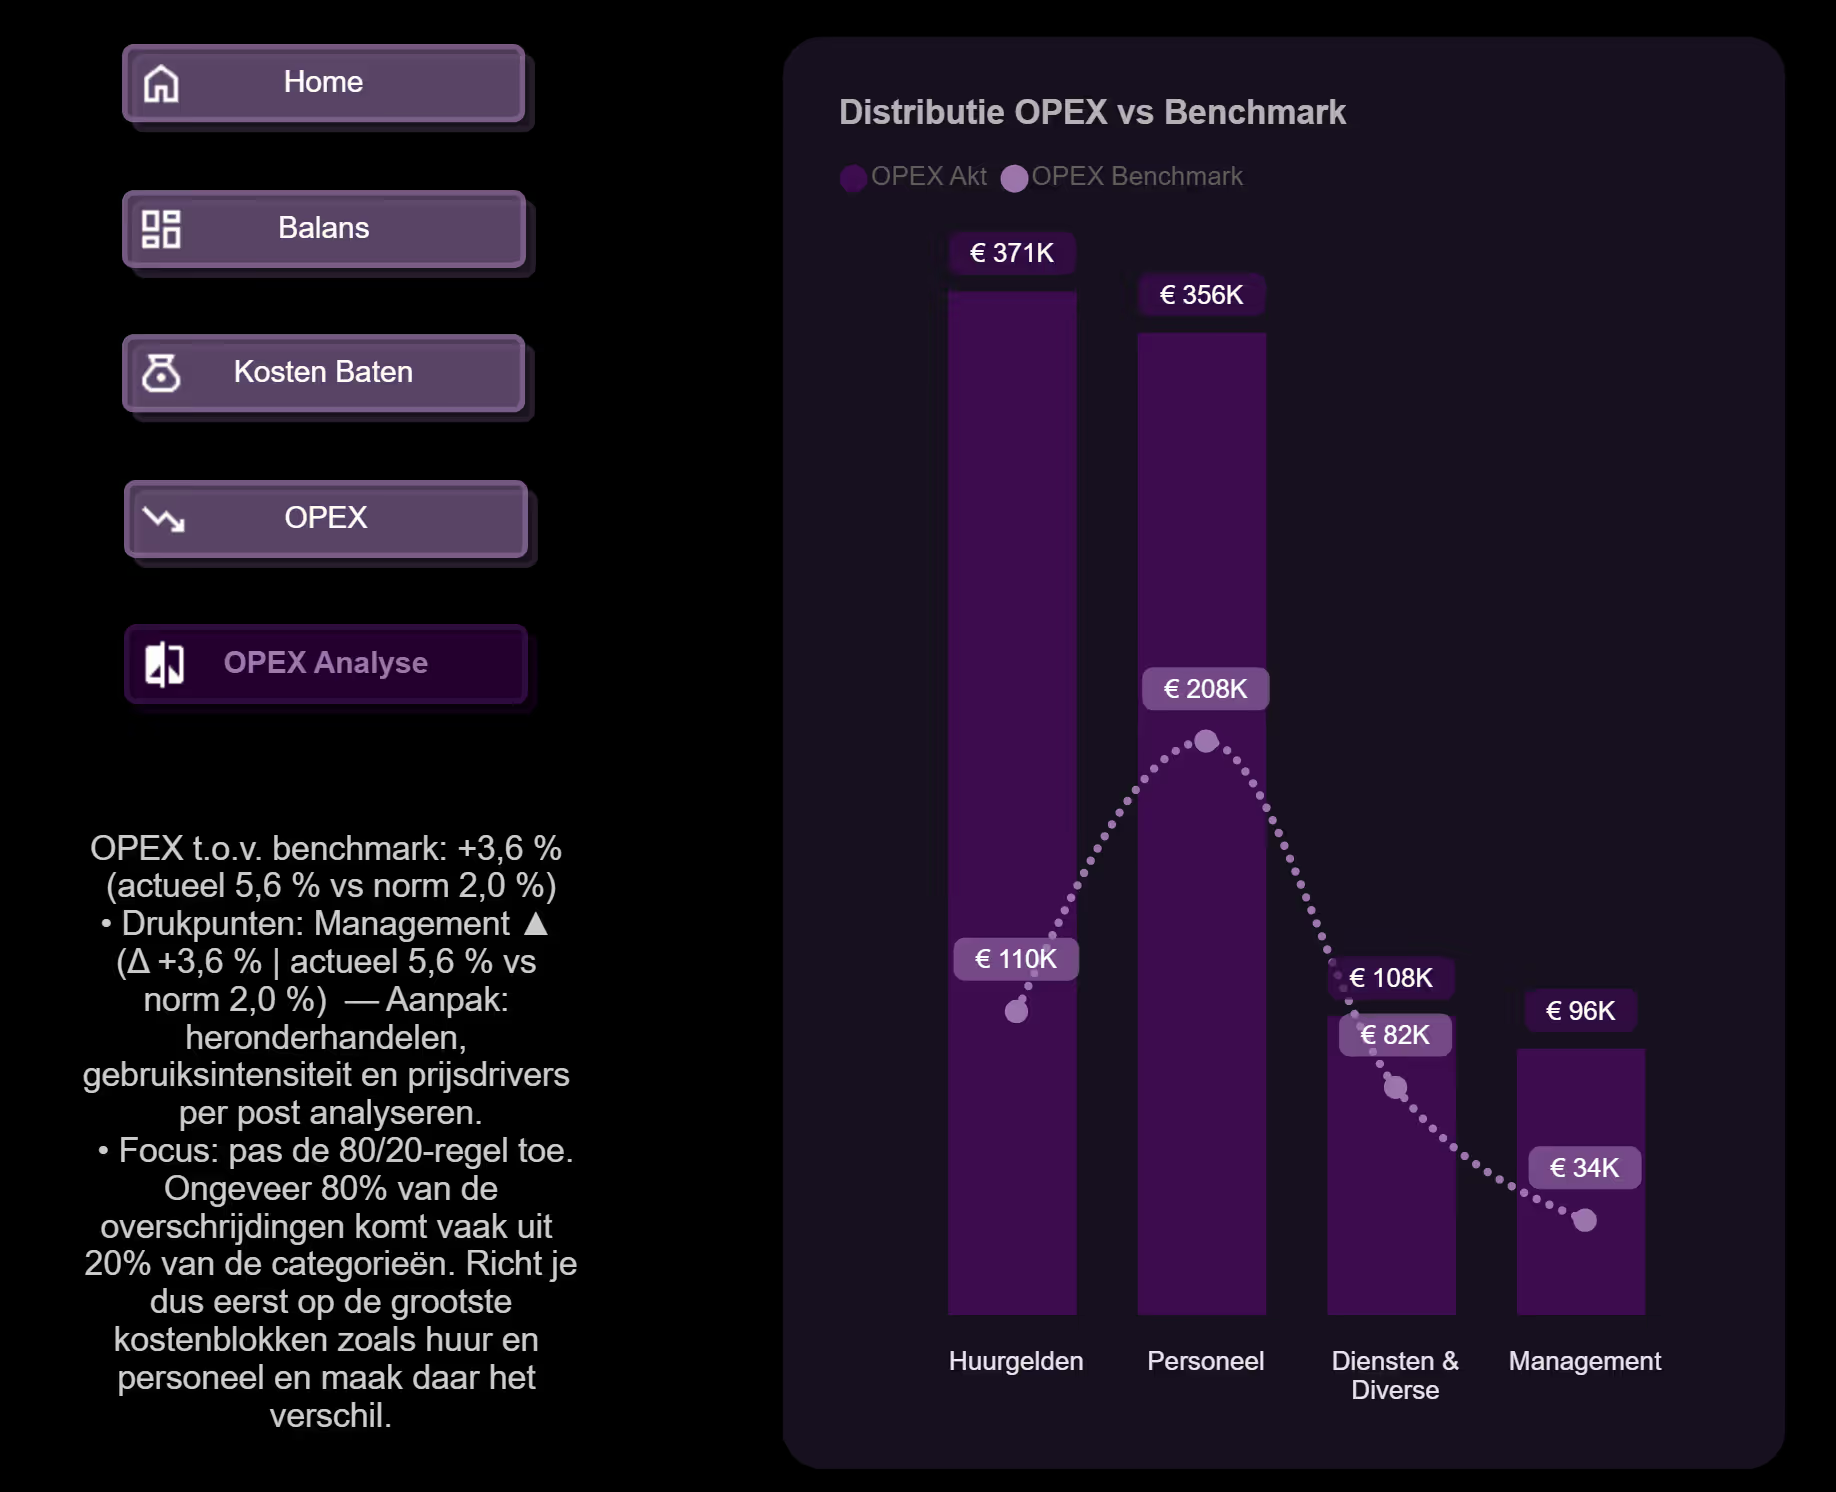
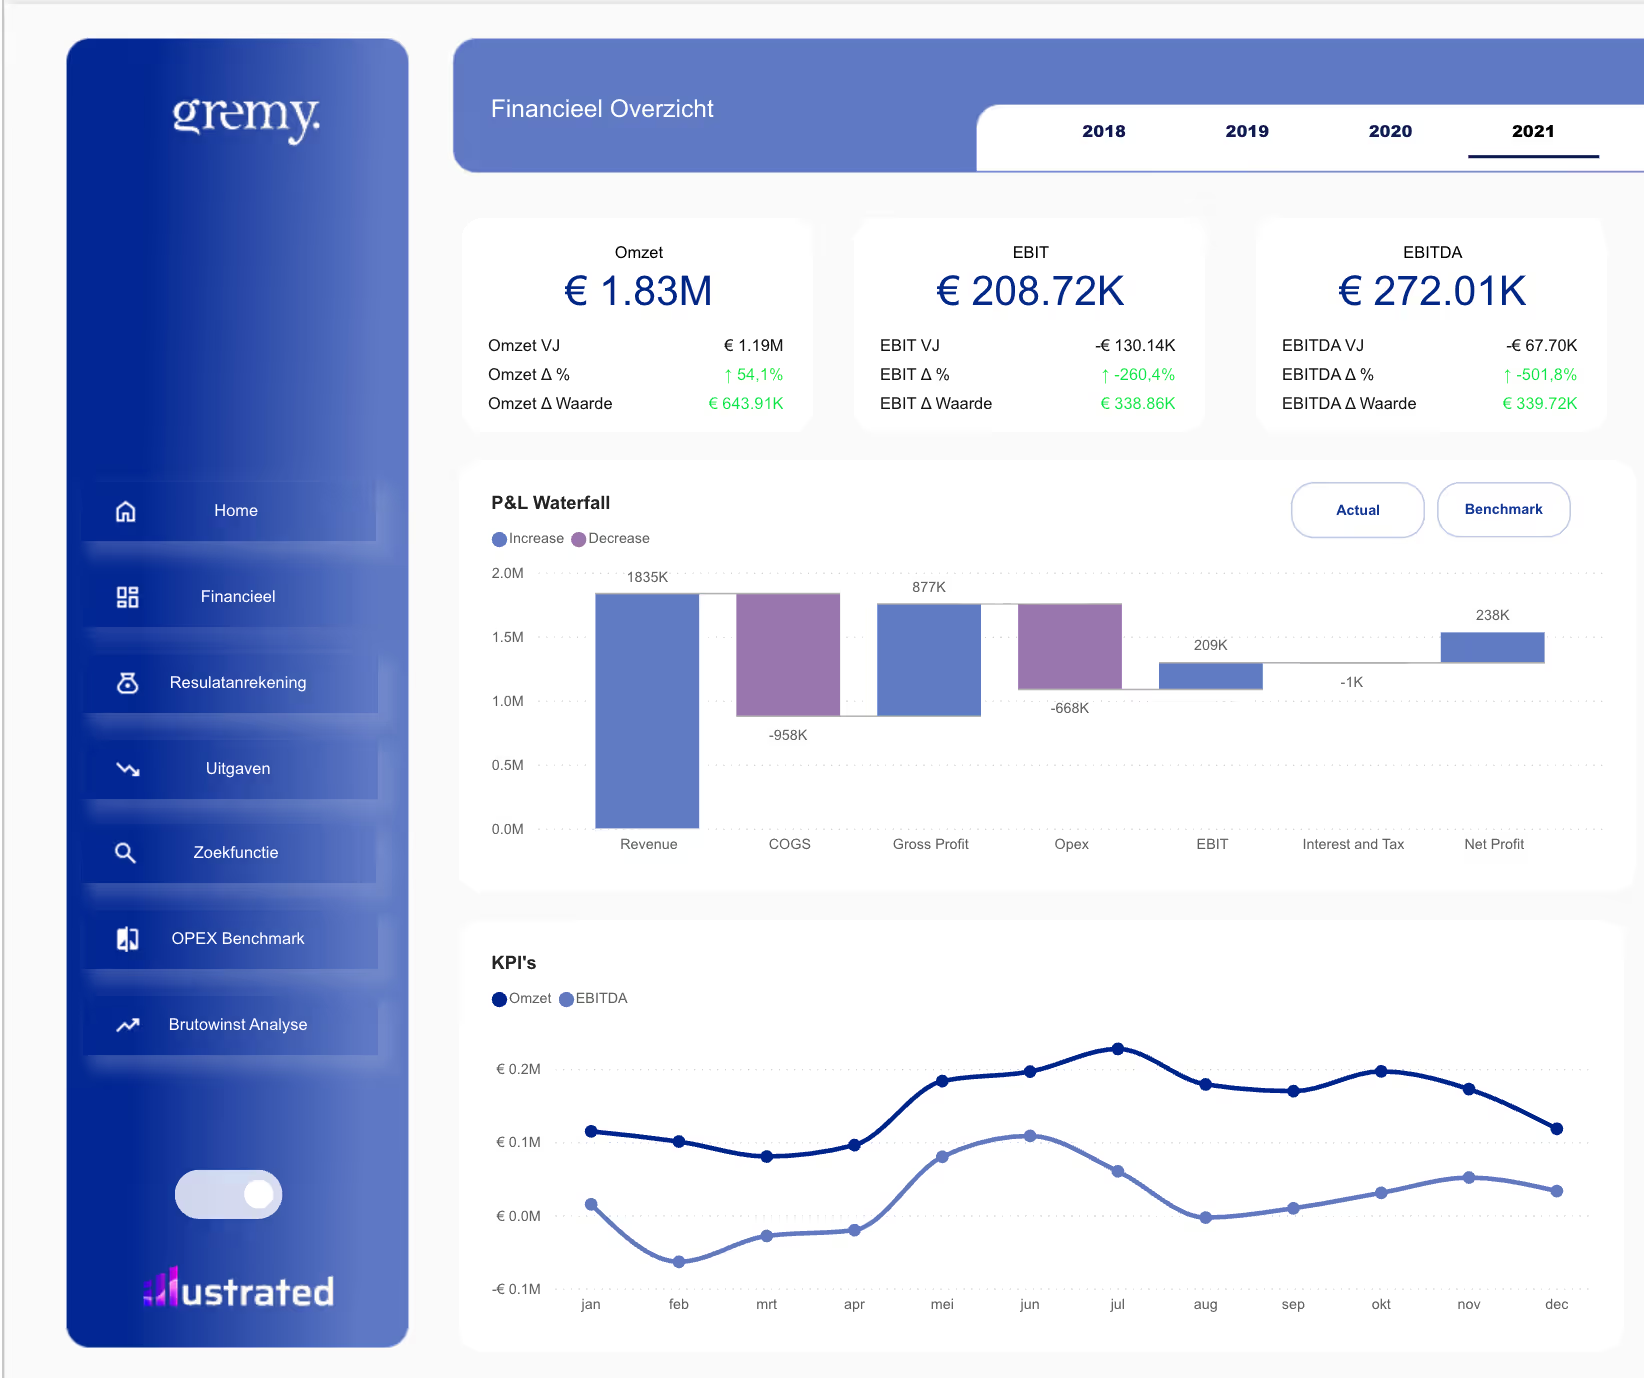
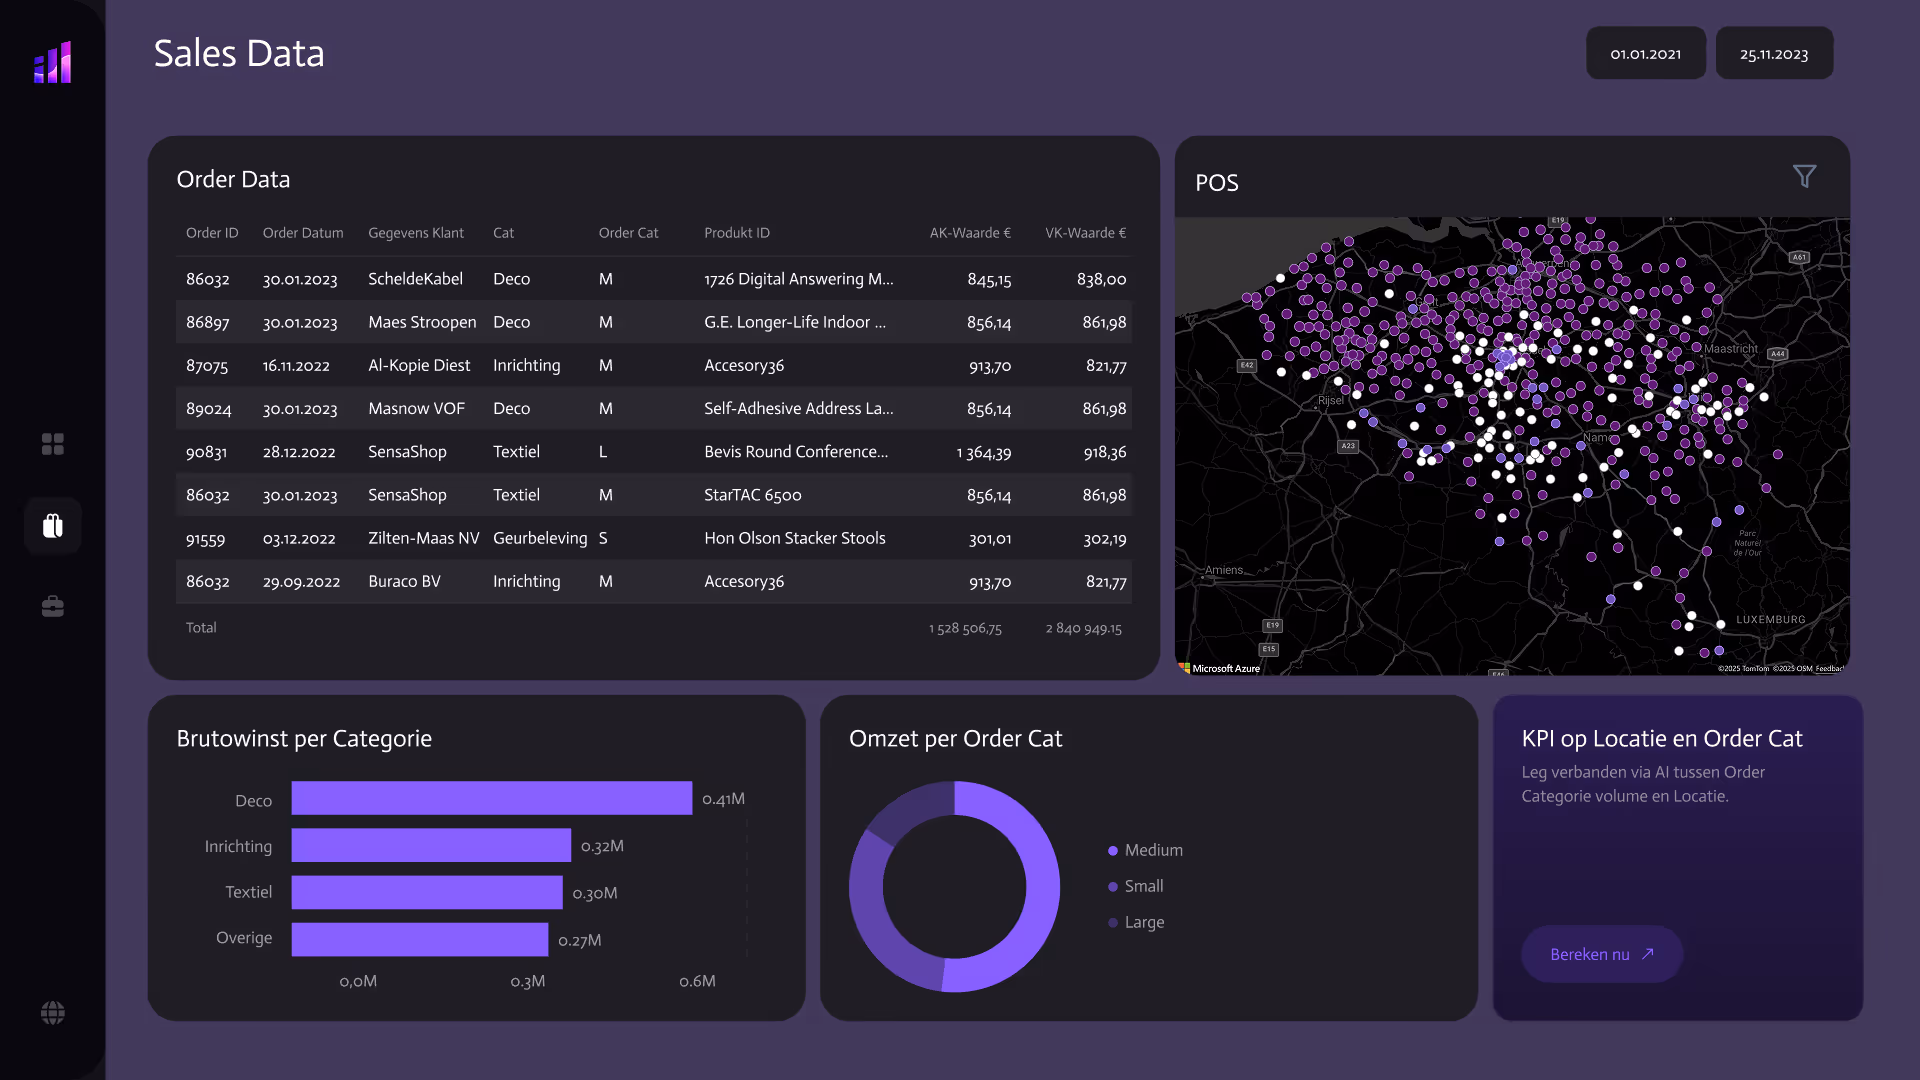
Finance Overview
See your revenue, costs and margins at a glance. Know exactly where your money goes, every day.
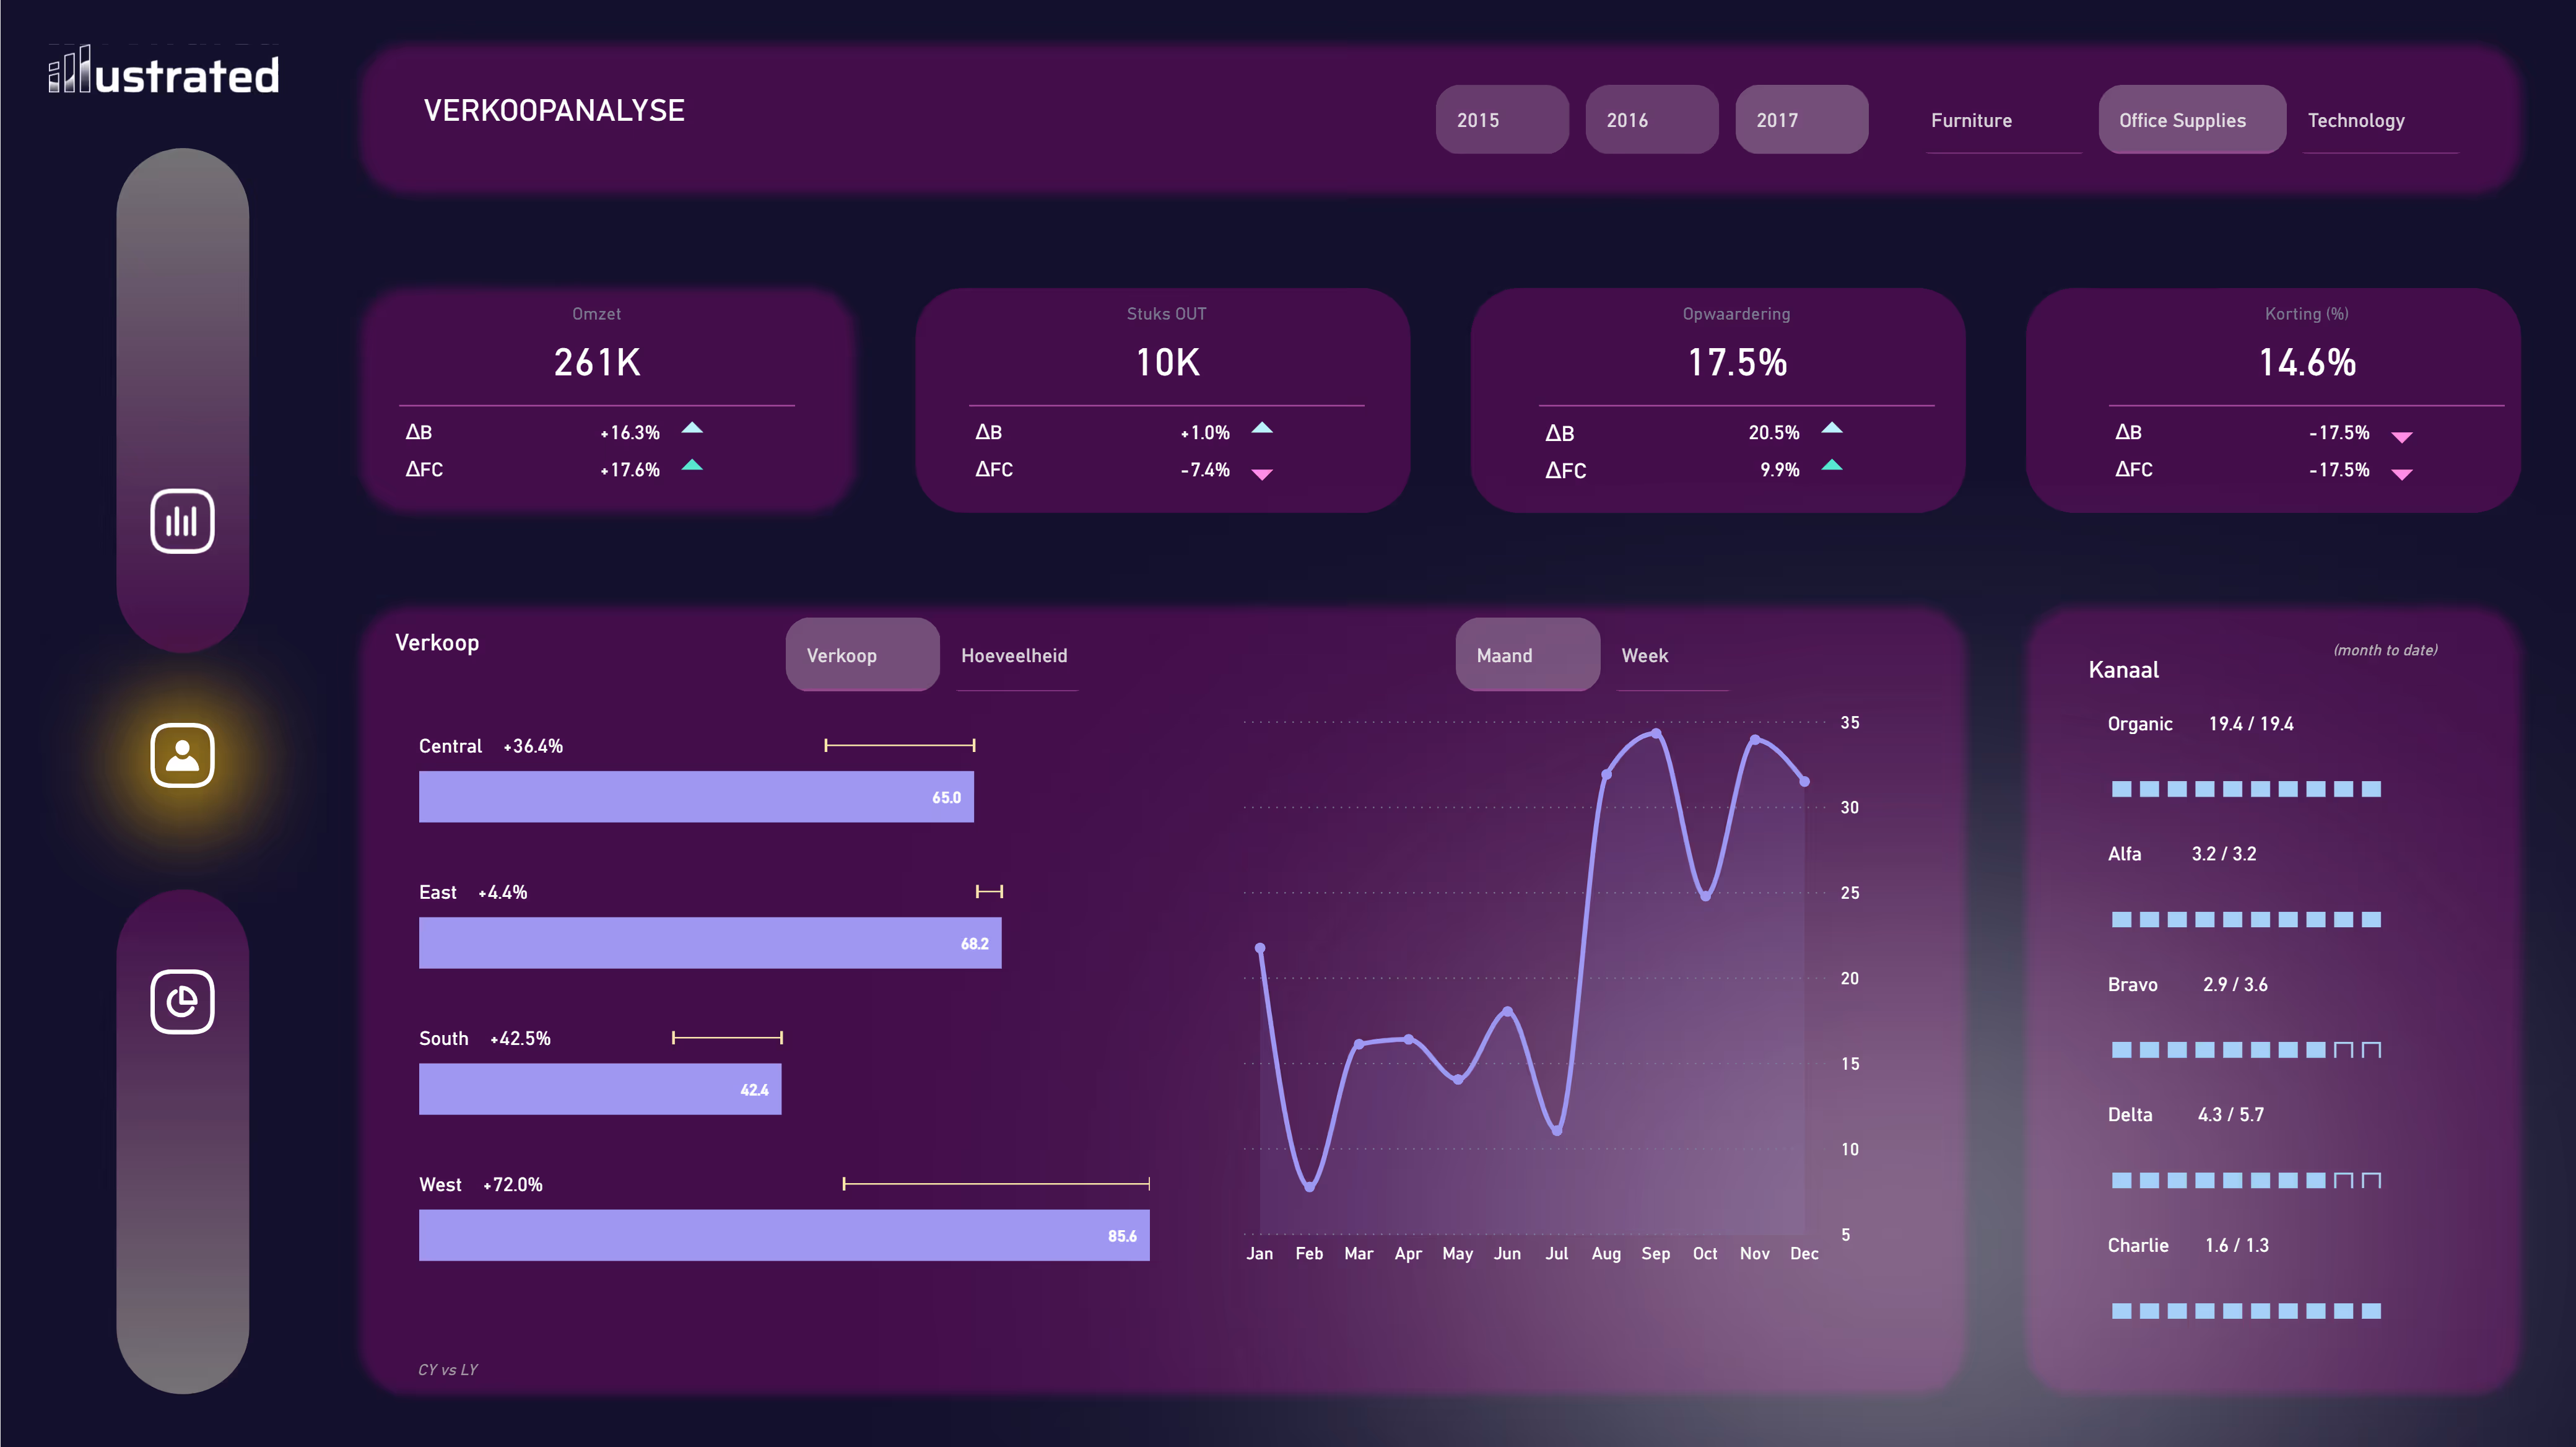
Sales Insights
See how your sales are performing, the heartbeat of your business.

Mobile Insights
See your most important data at a glance,
wherever you are.
Smart Alerts
See the signals when something is wrong, so your team stays in control.
.svg)
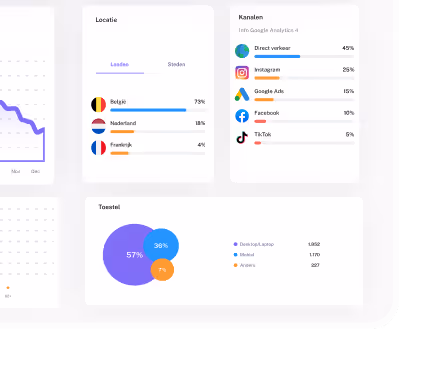
Marketing Performance
See which channel delivers, which slips.
HR Insights
See if your teams are present and in balance.

Dashboards when you need insight. Leadership when you need direction.
We build custom dashboards, apps and reports using tools like Power BI, Microsoft Fabric, Retool, Tableau and modern AI technologies. Behind every clear interface sits a reliable and future-proof data structure, ensuring your data is consistent, accurate and always up to date.
Whether your data lives in Excel, SQL, ERP, POS, CRM or marketing platforms, we bring everything together into one clear source of truth. This gives SMEs live insight into finance, sales, marketing, HR, planning, operations and more, fully tailored to their reality.
But insight alone is not always enough.
When extra direction is needed, Illustrated can also step in as an interim CEO / CEO for hire. We support founders and management teams with temporary leadership, structure and decision-making power, always hands-on, pragmatic and grounded in data.
Every collaboration is à la carte. No templates. No fixed packages.
From business intelligence to executive support, we help your business move forward with clarity and confidence.
Illustrated is a Belgian partner specialised in data, automation and executive decision support for SMEs.
With our free prototype, we show you within a few days how clarity can unlock growth.