Financial clarity, finally.
gross profit increase
daily data refresh
from chaos to full control
The challenge
A retail company had no real-time financial insight.
Numbers arrived only once a year, which made it impossible to steer the business or make confident decisions.
The owner relied on gut feeling instead of facts.
This created stress, uncertainty and missed opportunities.
What we built
Real-time financial visibility
We connected their ERP data and created a unified flow that refreshes 48 times a day.
For the first time, the business could see its numbers as they happened.
This included revenue, gross profit, OPEX, daily trends and more.
Extended reporting on demand:
We added deeper insight such as invoice-level detail, category breakdowns, supplier views and multi-year filters.
Proactive alerts:
We identified unusually high OPEX levels and confirmed this with market benchmarks.
They now receive automatic alerts whenever expenses rise beyond predefined thresholds
The breakthrough
The company discovered that their gross margin was stronger than expected.
With improved visibility, we advised two strategic actions:
- Lower OPEX through rent adjustments, staff allocation and internal structure
- Reinvest the available margin to increase sales and profit
A year later he knows his numbers before his accountant does.
HR made clear, finally.
of the wage rise was pure indexation
absenteeism
branch where the real problem sat
The challenge
Wage costs kept rising due to yearly indexation.
The team was older than the sector benchmark, which increased salary levels.
Absenteeism was high and required expensive interim staffing.
Compensation did not match performance.
One branch showed issues that influenced the entire company.
What we built
Wage analysis and benchmark comparison
We analysed the evolution of wage costs and identified that almost all increases came from yearly indexation.
By comparing the team’s age distribution and salary levels with sector benchmarks, it became clear that the workforce was older and therefore more expensive than comparable companies.
This phase was covered by our free startup package.
Absenteeism insights
We highlighted employees with persistent absenteeism and quantified the financial impact of interim replacements.
This gave the company a clear view of the long-term cost of absenteeism and the leverage needed to address it.
We put wage evolution, absence patterns, performance ratings and branch differences into a single overview. It showed how wage costs had developed, how the team compared with the sector, which people were persistently absent and what each branch contributed. One screen instead of four spreadsheets and a gut feeling.
The breakthrough
The company introduced a non-recurring bonus that encouraged employees to reduce absenteeism.
Absence levels dropped quickly and interim expenses decreased.
A full internal evaluation aligned compensation with actual performance, which restored fairness and balance across the team.
A branch-level review revealed management issues that affected the entire organisation.
The leadership of that branch was replaced and strengthened, which improved overall stability and performance.
Our advice
- Compare branch-level performance to identify structural issues and management gaps.
- Replace and strengthen leadership in the branch that had a negative impact on the organisation.
Together those moves restored fairness in the team and took the volatility out of the HR budget.
A year on, wage costs are predictable, absences are down and people are paid for what they actually deliver.
Marketing performance, at last.
campaign ROI
underperforming channels
improved targeting accuracy
The challenge
The company was investing heavily in marketing, but results were unclear.
Channels were managed separately, making it impossible to see which efforts drove actual revenue.
Campaigns ran without clear attribution, budgets were difficult to justify, and high-performing content was often discovered too late.
Marketing decisions relied on intuition instead of data, leading to missed opportunities and inconsistent growth.
What we built
Unified marketing overview
We connected the platforms into one dashboard: social ads, Google Ads, email campaigns, website analytics and sales data. One view of what every channel contributes to leads, revenue and repeat custom.
This phase was covered by our free startup package.
Channel performance insights
We mapped every touchpoint: from first ad impression to website visit, conversion and repeat purchase.
This showed the company precisely where prospects dropped off and which content drove the strongest engagement.
Proactive alerts
We built alerts that notify the team when a campaign overspends, drops in performance or suddenly spikes.
This ensured fast reaction times and prevented unnecessary budget loss.
The breakthrough
The team could finally say which channels worked, which audiences converted and where money was leaking. Budget discussions stopped being one opinion against another. Marketing meetings turned into decisions.
Budget now goes where it earns its keep. Marketing stopped being a cost they hoped about and became something they steer.
Field sales optimisation
No retailer left without follow-up
Area coverage
tap to see who is nearby
The challenge
The field team relied on a simple Excel export from Exact: a flat list of clients and sales figures, with no structure, no priorities, and no geographic logic. Representatives planned visits manually, often driving to one town for a single client, only to return to the same area later that week for another.
The result was clear: inefficient routes, lost time, inconsistent follow-up, and a field operation without structure.
What we built
A location-based field app
We built a simple mobile app that uses the representative’s phone location to show all nearby clients within a chosen radius.
Wherever they are, they instantly see which customers are close.
This phase was covered by our free startup package.
Clear visit priorities
The app highlights clients who haven’t been visited for a long time, who stopped ordering, or who are at risk of churn — all in one view on their phone.
Prospects included
It also displays potential new clients in the area, helping representatives combine follow-up with prospecting in a single route.
The breakthrough
From the first week the reps stopped planning blind. Wherever they parked, they could see which customers were around the corner: the ones overdue a visit, the ones who had gone quiet, and the prospects they had never called on. No more driving to one town for a single client and back to the same area three days later.
Less time in the car, more customers per day, and nobody falling off the list any more.
CEO for rent
Margin improvement per project
Projects analysed
day cashflow horizon
The challenge
A growing roofing company was struggling with visibility and control.
Projects overlapped, material prices fluctuated, and subcontractors invoiced at irregular intervals.
By the time financial results became clear, the work was already finished, leaving no room to adjust or intervene.
Margins varied strongly between projects, but the root causes remained unclear.
Decisions were increasingly based on experience and intuition rather than facts.
The owner didn’t need another full-time manager.
He needed temporary executive support to restore control, protect margins and make confident decisions, without slowing down daily operations.
Our approach
We started by listening: the existing processes, the running projects, the cost structure and the way decisions were made. Then we pulled the data together from estimates, invoices, purchase orders and time tracking, and built a live project dashboard that refreshes several times a day. The owner could see revenue against cost, materials, labour and subcontractors, and how the margin moved while the work was still running. Not after handover. During. This first setup fell under our free startup phase.
The first findings pointed at what to build next: cost tracking per project, material use and price movement, labour efficiency per crew, subcontractor cost consistency, and extras that had been carried out but never invoiced. We added historical data so projects, teams and periods could be compared, which turned isolated problems into visible patterns. Cashflow projections at 30, 60 and 90 days let the owner see pressure coming instead of running into it. At that point the dashboard stopped being a report and became something he took decisions with.
With reliable data in place we could look at projects while they were still running, so margin erosion showed up early enough to act on. Three patterns kept returning: labour hours underestimated on certain project types, material price increases that were never passed on, and cost control that varied from one subcontractor to the next. We set alert thresholds, so any deviation beyond the limit gave a signal the same day. The work at that stage was not analysis. It was taking the decisions that protected the margin.
The breakthrough
The analysis revealed a clear and actionable insight.
Not all projects were the problem.
Several project types consistently delivered strong margins, but they represented only a small share of total volume.
At the same time, low-margin projects absorbed a disproportionate amount of time, labour and working capital.
This shifted the strategic focus.
Instead of increasing volume, the priority became improving project selection and execution.
Pricing logic was adjusted, labour assumptions were corrected and material price movements were structurally accounted for.
A simulation model showed that fewer projects, executed with the right margin, could generate higher profit while reducing operational pressure.
For the first time, growth and control were no longer opposing forces.
The result
He got control back without putting another manager on the payroll. Margins are visible while the work is running, not three months after handover, so decisions come earlier and cost less. Cashflow improved through steadier planning, billing on time and tighter grip on cost. The low-margin work was cut back in favour of the jobs that consistently pay.
This was not a consulting report. We sat in the chair, took the decisions, put the structure in place and then stepped out again. No long contract, no extra headcount.
The data existed. It was just never recorded.
4
reps record every visit on their own phone
0
logins: the app opens and you pick your name
1x
entered, and the planning runs on that same record
The challenge
At a contractor, four reps drove out to customers every day. Ten minutes on site and they knew exactly what had to happen.
What we built
That knowledge stayed in their heads, in loose photos on their phones and in messages to the office. Whoever built the planning had to ring back every time to find out how urgent a job was and what it would take.
There was no shortage of data. There was a shortage of capture.
A capture app for the field
An app on the phone, with no login. You pick your name and you start. Nobody standing in the rain with gloves on is going to sign in.
Photos, measurements and notes on the spot, including when the signal drops. Every record gets an urgency label, urgent, by appointment or not urgent, and a target date. On closing, a job sheet comes out as a pdf and the same data goes to the database.
A planning board that runs on that same data. Four crews of three, scheduled per day. Records are dragged onto the board with their urgency and target date beside them. What was entered in the field, nobody at the office has to retype.
The breakthrough
The question was never which report was missing. The question was where the data is created.
Two things change. The record is made where the work is, once, by the person who sees it. And the planning starts from that same record, with no retyping and no calls back to the office.
Once that is in place, planning becomes a consequence instead of a puzzle. And only then does measuring become possible: lead time, how many visits turn into an order, which crew finishes fastest where.
Where it stands today
Four reps capture every visit on their own phone. No logins. Entered once, and the planning runs on that same record.
The information was always out there on site. Now it is in the system as well.
Data Solutions for Clarity, Control & Growth
Show.
Don't tell.
Whatever your business needs, we turn your data into clarity, efficiency and measurable growth.
Finance dashboard
Track revenue, costs, and margins with ease. Always know where your money goes.
HR analytics
Wage cost evolution, absences and planning. HR essentials, finally clear.
Marketing performance
See which channels perform, which campaigns drive results and where your marketing truly works.
Field sales
Your reps open their phone and see which customers are nearby, who is overdue a visit and who stopped ordering.
CEO for rent
Executive support for a set period. We take decisions with you, put structure in place and step out again.
Work preparation
Your people capture the job where it happens: photos, measurements, urgency and a target date. Planning starts from that same record.
.svg)
 Google Ads
€ 29
Google Ads
€ 29
 Instagram
€ 16
Instagram
€ 16
 Facebook
€ 14
Facebook
€ 14
 TikTok
€ 3,5
TikTok
€ 3,5
| Customer | Distance | Last order | Status |
|---|---|---|---|
| bakery | 1,2 km | 71 d | follow up |
| garage | 2,8 km | 56 d | visit overdue |
| pharmacy | 3,4 km | 19 d | on track |
Looking for something beyond the standard?
Your business isn't standard. Your data solutions shouldn't be either.
We craft custom insights built entirely around your needs.
Ask your figures in plain language
We built a full AI integration on the live figures. Asking a question now works like asking your accountant, and the answer comes back as a finished report with the numbers behind it.
Missed client visit alerts
Missed clients? Not anymore. We built a system that flags clients needing attention, helping distributors maintain strong customer relationships.
Retail coverage vs. population dashboard
By comparing retail presence with the population in each municipality, we showed exactly where the brand is strong and where it is missing out.
Live stockscreener
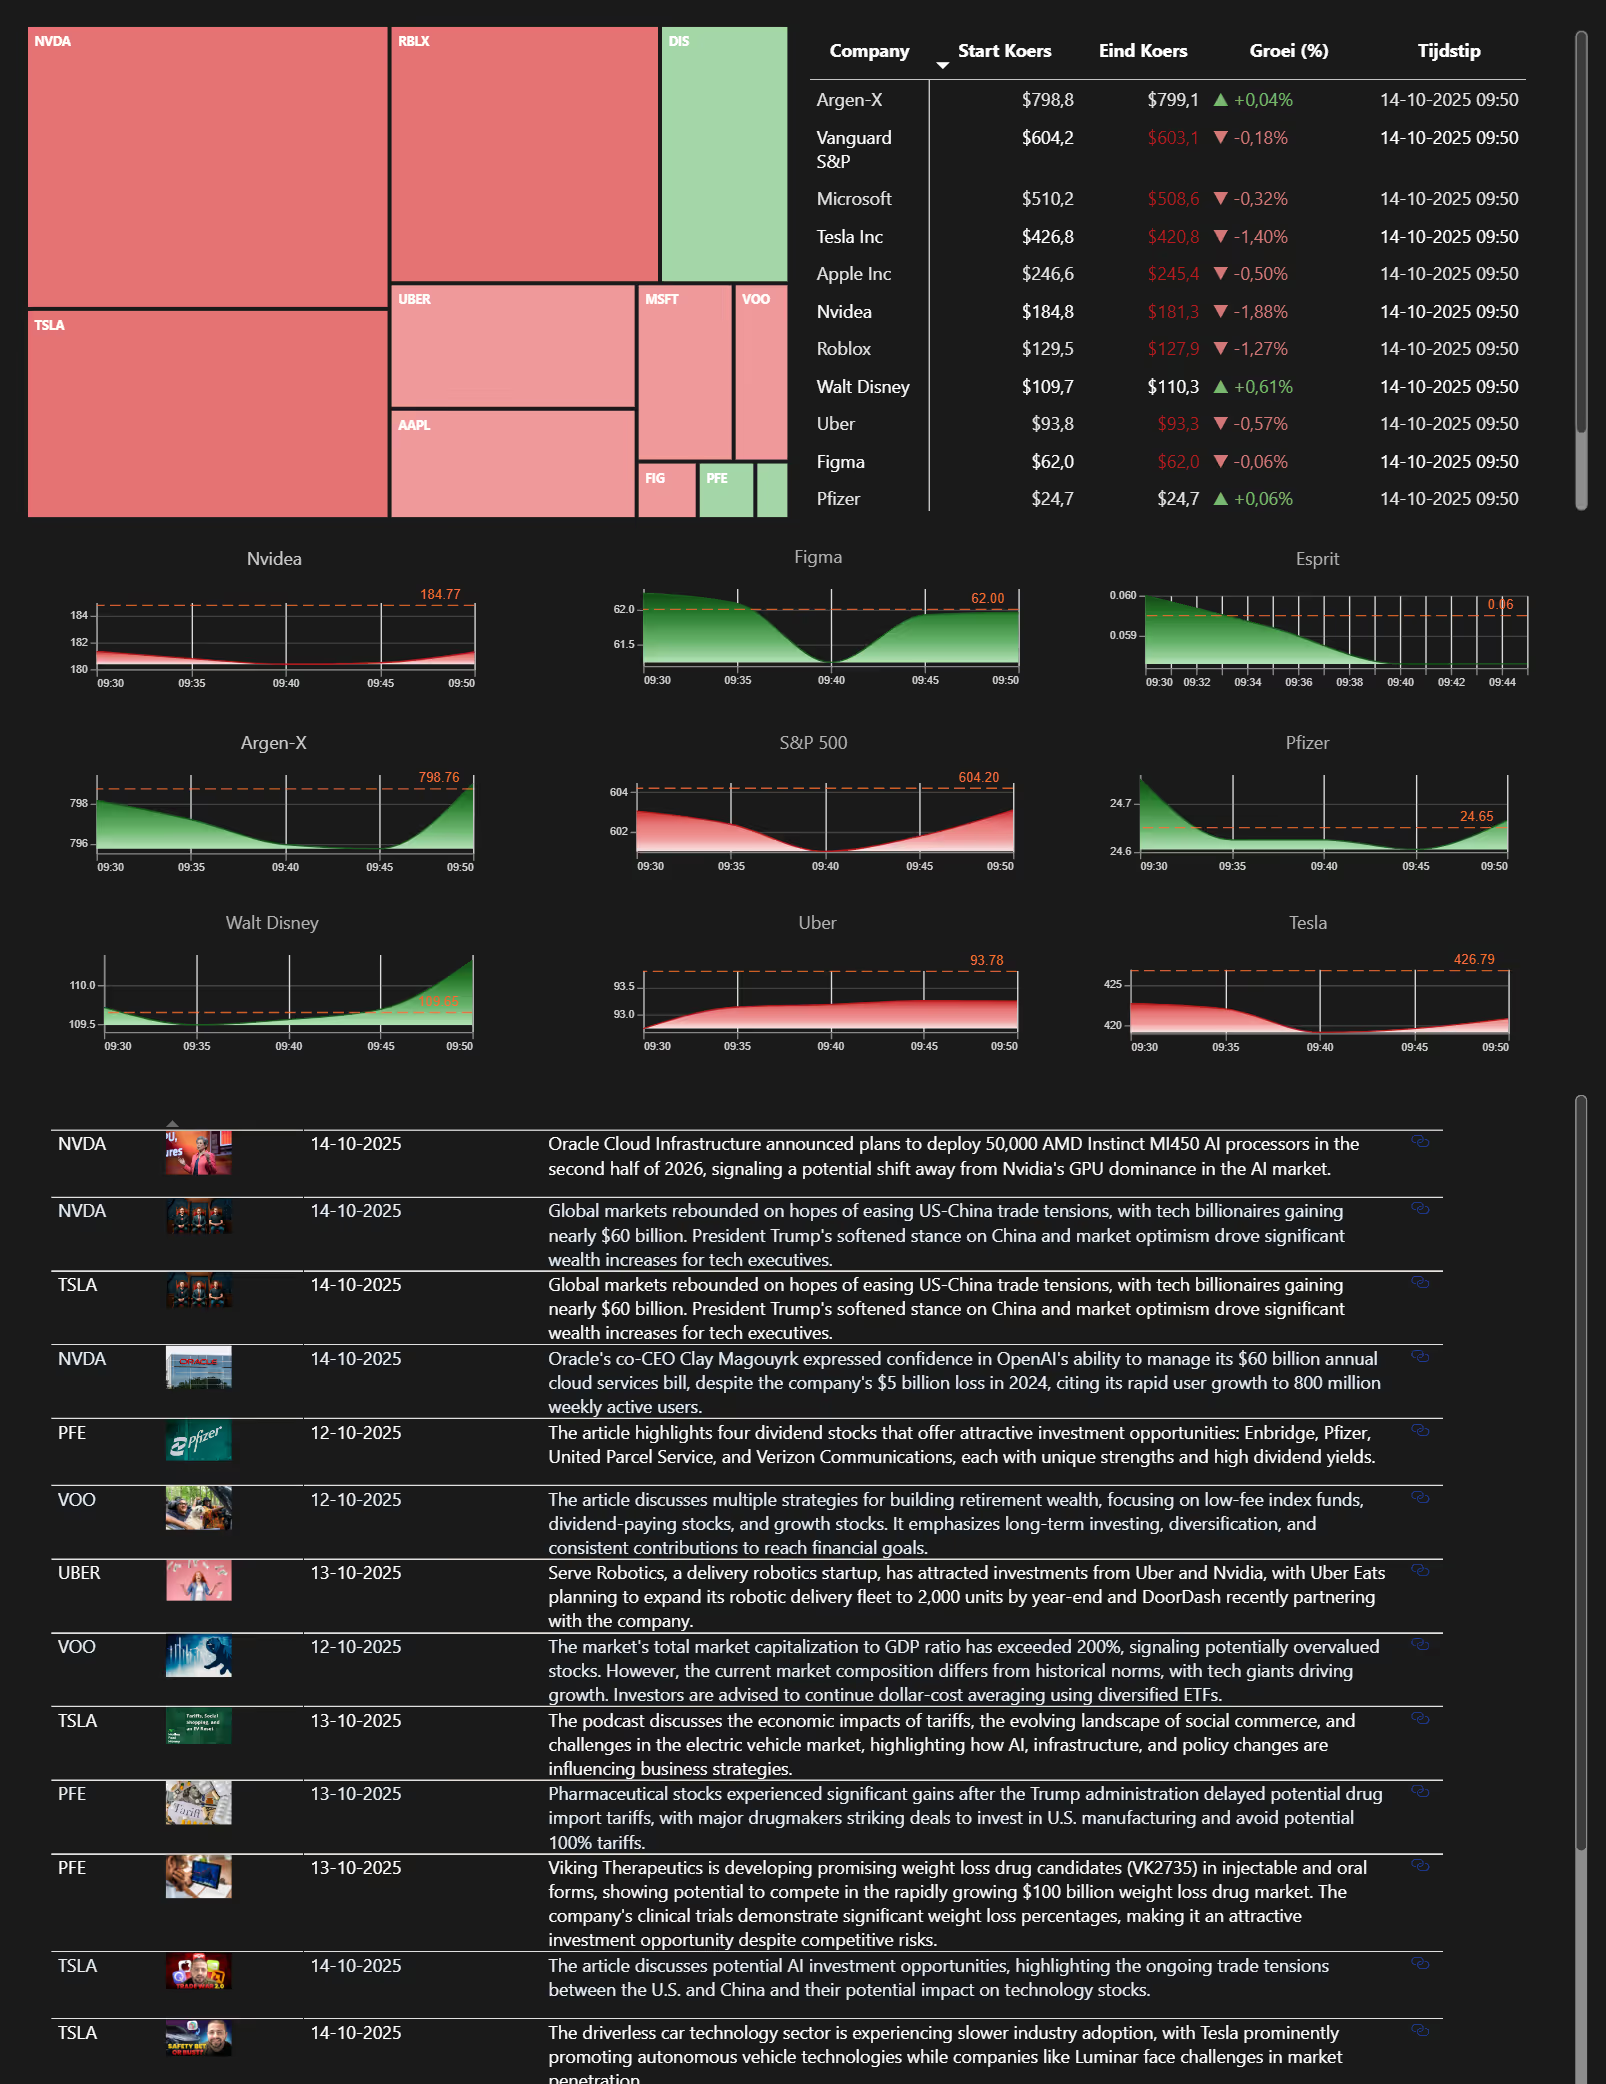
The Illustrated StockScreener analyzes hundreds of companies at a glance.It automatically evaluates each business on quality, growth, financial health, and valuation using real-time data.
Mobile sales route planner
We built a real-time route planner for two mobile teams, tracking their day, optimizing every route and increasing efficiency.

When insight is not enough.
Insight is essential to make good decisions. But sometimes insight alone is not enough.
CEO for hire provides experienced, temporary support for business owners who just need a second opinion at critical moments.
Not as a replacement, but as a sounding board.
We help bring strucure, clarity and direction when decisions carry weight, without the need for a permanent executive hire.