KPI Dashboard: What Is It, Why You Need One, and How to Get Started
Make better decisions with a KPI dashboard. Learn what it is, which KPIs to track, and how to build one today.
KPI Dashboard: What Is It, Why You Need One, and How to Get Started
You know the drill. End of the month, and you're digging through Excel again. Numbers from three different systems. An accountant who won't get back to you for another six weeks. And that one figure that doesn't add up but nobody knows why.
Meanwhile, you're making decisions based on gut feeling. Is the business doing well? Probably. But do you know for sure? No.
That's exactly where a KPI dashboard makes the difference.
What is a KPI dashboard?
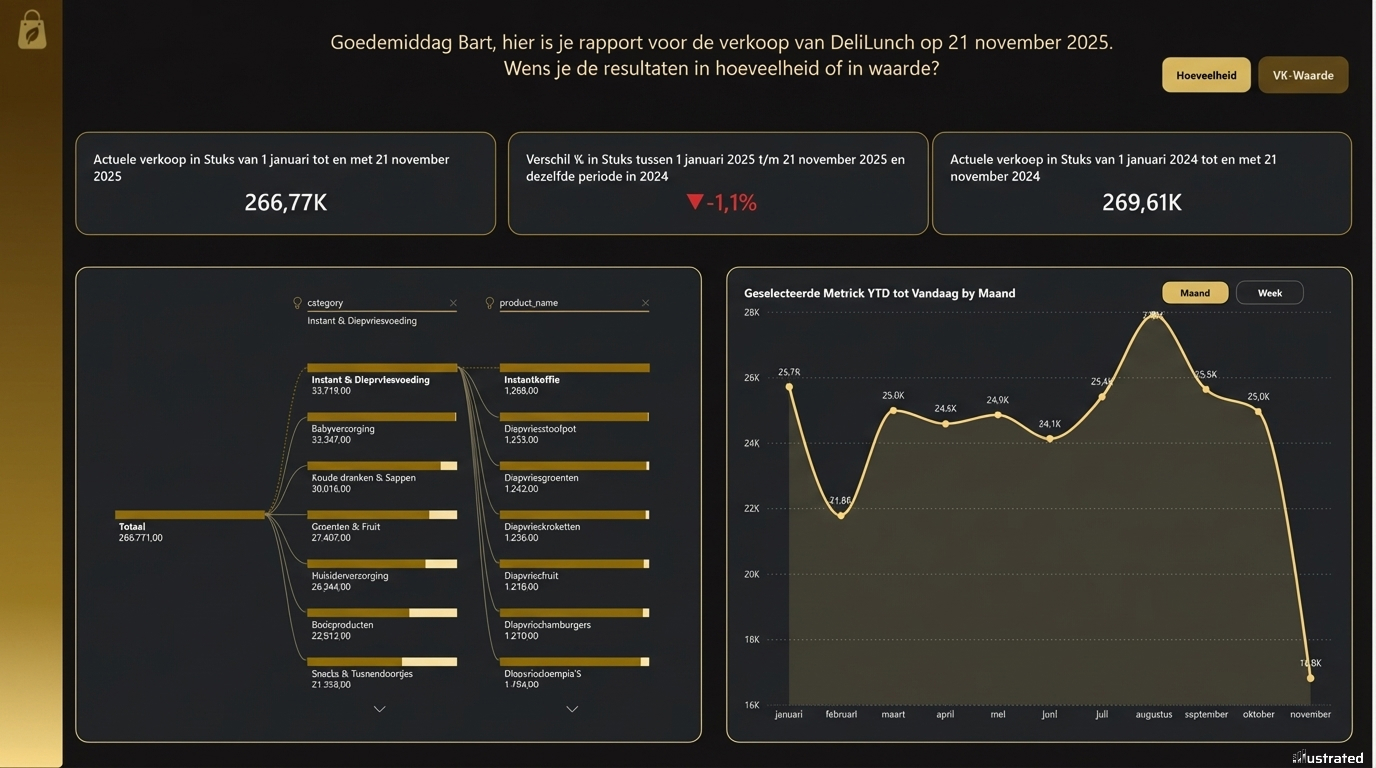
A KPI dashboard is a single screen that shows the most important numbers of your business — live, visual, and without having to dig for them.
KPI stands for Key Performance Indicator. In plain terms: the numbers that actually matter. Revenue, margin, outstanding invoices, sick leave, conversion rate, stock levels — depending on what drives your business.
A good dashboard doesn't show everything. It shows just enough to know whether you're on track. And if you're not, where things are going wrong.
Think of it like the dashboard in your car. You don't need to understand how the engine works. You just want to know: do I have enough fuel, am I speeding, and is something broken?
Why do you need one?
Small and medium-sized businesses make decisions every day. But most do so with incomplete information. Data is scattered across Excel, your accounting software, your CRM, your e-commerce platform. By the time it's all pulled together, it's already outdated.
A KPI dashboard solves three problems:
You see what's happening now, not what happened three months ago.Updated in real time or daily. No stale exports, no surprises at year-end.
You compare apples to apples.All data in one place, in the same format. No more debates about which number is correct.
You decide faster.When you can see at a glance that your margin is dropping or your stock is stuck, you can act. Not next month. Now.
Which KPIs belong in it?
That depends on your business. But here are the most common ones by area:
FinanceRevenue, gross profit, EBITDA, accounts receivable, cash flow, costs by category.
SalesNumber of leads, conversion rate, average deal value, revenue per rep, sales cycle length.
MarketingWebsite traffic, cost per lead, ROI by channel, click-through rate, engagement rate.
HRStaff costs, absenteeism, turnover, open vacancies, training budget.
Operations & inventoryStock turnover, delivery times, production capacity, error rates.
Don't start with everything. Pick five to ten KPIs that directly impact your decisions. Add the rest later.
Tools to build a KPI dashboard
There are dozens of tools on the market. The most common for SMEs:
Power BI — Powerful, affordable, and integrates well with Microsoft products. Ideal if you're already using Excel or Dynamics.
Tableau — Visually strong, popular with larger companies. Slightly steeper learning curve.
Looker Studio (Google) — Free, great for marketing dashboards and Google Analytics data.
Retool — Flexible platform for building custom apps and dashboards on your own data.
Which tool fits best depends on your data sources, your budget, and how custom you want it. Turning an Excel export into a simple Power BI report can be done in a day. A fully integrated dashboard pulling data from five systems takes more work — but delivers more value too.
Common mistakes
Too many KPIs.If everything is important, nothing is. Keep it simple.
Data that's wrong.A dashboard is only as good as the data going into it. Garbage in, garbage out. Invest in a clean data structure before you start visualising.
Building without purpose.Don't start with "I want a dashboard". Start with "what decision do I want to make better?" The dashboard follows from there.
Build once and forget.Your business changes. So do your KPIs. Schedule a quarterly check-in to see if you're still measuring what matters.
How do you get started?
Step 1: Define your key questions. What do you want to know that you don't know now?
Step 2: Identify where that data lives. ERP? CRM? Excel? Google Analytics?
Step 3: Pick five KPIs to start with. No more.
Step 4: Build a first version. It doesn't have to be perfect. A working prototype teaches you more than weeks of planning.
Step 5: Use it. Look at your dashboard every week. Adjust what doesn't work.
Don't feel like doing this yourself?
At Illustrated, we build KPI dashboards for SMEs. We connect your data sources, structure what's needed, and deliver a dashboard you'll actually use.
We always start with a free prototype. No obligations, no subscription. Just your own numbers, clearly presented.