The semantic model: where your numbers get one meaning
Between your database and your dashboard sits a layer that decides what revenue, margin and last year mean. What a semantic model is, and why it is the most important layer you never see.
Ask three people in a small business what last month's revenue was, and you get three numbers.
Nobody is lying. Accounting counts the invoices, sales counts the orders and the store counts what went over the counter. Those are three correct answers to three different questions.
The semantic model is where you decide which of those questions is “revenue”. Once, for everyone.
Three layers, not one
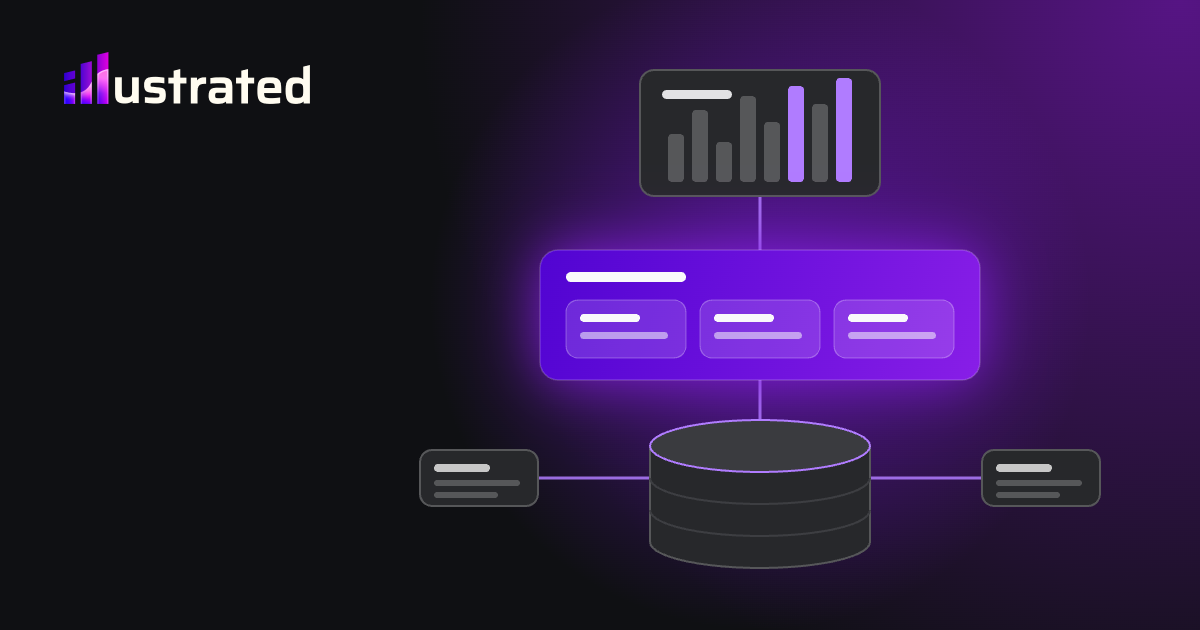
A dashboard looks like one thing. For us it is three layers.
At the bottom sits the database. For us that is PostgreSQL, in a cloud data center at Azure or AWS. Every night the data from your accounting, your till and your webshop comes in there. There it gets cleaned, linked together and checked.
At the top sits the report: the charts, the tables, the screen you see.
In between sits the semantic model. In Power BI it is literally called that. It is the layer that turns raw tables into a language your business speaks.
What goes into it
The tables and how they connect. Facts in the middle, dimensions around them. How that works, you can read in the article on the star schema.
The calculations, with a name. Revenue is excluding VAT and after credit notes. Gross margin is revenue minus the cost of what you sold. That definition is fixed once, in one place. If you want to learn to write those calculations yourself, the basics are in the lesson on DAX.
Time. A calendar with every day in it, so “last year” and “since January” mean the same in every report. Why that calendar exists separately is explained in the article on the data model.
Names in plain language. Not account 700000 but Revenue. Not dim_location but Store.
Who gets to see what. A store manager sees their own store, the owner sees everything. That lives in the model, not in ten separate reports.
Why this is the most important layer
One truth. Every report, every export and every question uses the same definition. Change it, and it changes everywhere at once.
New questions, faster. Building a new report is quick, because the calculating has already been done. You only choose what you want to see.
Questions in plain language. If you ask your numbers questions in everyday language, you only get a reliable answer when there is a layer that knows what “margin” means. An AI that calculates straight on raw tables is guessing. An AI on a semantic model looks up the definition.
Where it goes wrong
Calculating in the report instead of in the model. Every report then calculates its own margin. After a year you have five versions, and they all differ a little.
Exporting and carrying on in Excel. As soon as the numbers leave the model, they lose their definition. The next person to open the file no longer knows what is in it.
Nobody who decides. If nobody owns what revenue means, whoever built the last report decides. That is what who guards the number is about.
The point
A dashboard is as reliable as the layer underneath it. The semantic model is that layer: the place where your business agrees on what its own words mean. Get that right once, and you never have to argue about it again.